A draft Makie theme exploring a cassette futurism / NASA-punk look for JuliaActuary plots: Apollo-era flight-plan manila, navy plotter-pen ink, instrument-panel accent pigments, draftsman tick marks, and a single monospace family throughout. JuliaMono stands in for a more bespoke draftsman face we’ll swap in later.
using CairoMakie
using Distributions
using Random

# Apply the site's custom Makie plot theme (cassette futurism).
include(joinpath(@__DIR__, "..", "..", "assets", "themes", "cassette_futurism.jl"))
set_theme!(cassette_futurism_theme())
Random.seed!(1969)
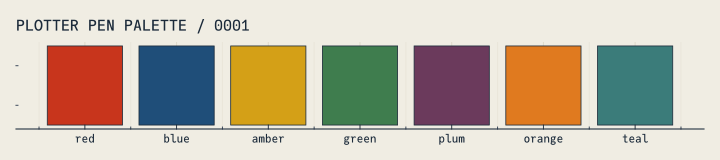
Palette swatch
let
    names = ["red", "blue", "amber", "green", "plum", "orange", "teal"]
    fig = Figure(size = (720, 160))
    ax = Axis(fig[1, 1];
        title = "PLOTTER PEN PALETTE / 0001",
        xticks = (1:length(CASSETTE_PALETTE), names),
        yticksvisible = false, yticklabelsvisible = false,
        ygridvisible = false, yminorgridvisible = false,
    )
    barplot!(ax, 1:length(CASSETTE_PALETTE), fill(1.0, length(CASSETTE_PALETTE));
        color = CASSETTE_PALETTE)
    hidespines!(ax, :l, :r, :t)
    fig
end
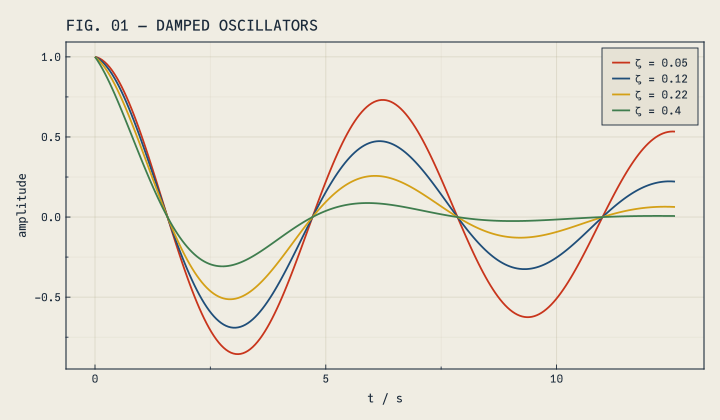
Line plot: trajectories
let
    t = range(0, 4π; length = 240)
    fig = Figure(size = (720, 420))
    ax = Axis(fig[1, 1];
        title = "FIG. 01 — DAMPED OSCILLATORS",
        xlabel = "t / s", ylabel = "amplitude",
    )
    for (i, ζ) in enumerate((0.05, 0.12, 0.22, 0.40))
        lines!(ax, t, exp.(-ζ .* t) .* cos.(t); label = "ζ = $ζ")
    end
    axislegend(ax, position = :rt, framevisible = true)
    fig
end
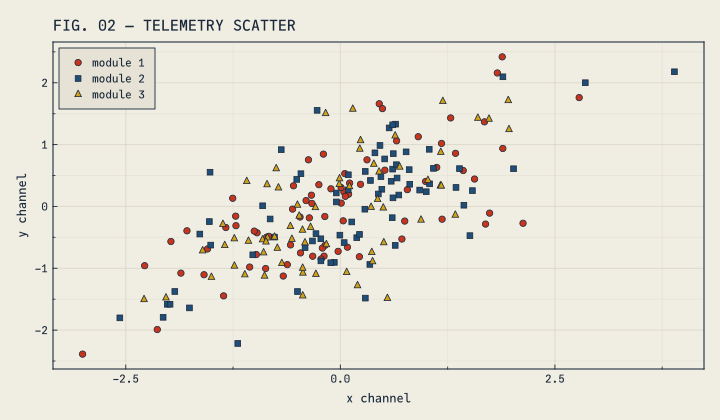
Scatter: bivariate sample
let
    n = 220
    x = randn(n)
    y = 0.6 .* x .+ 0.7 .* randn(n)
    groups = rand(1:3, n)
    fig = Figure(size = (720, 420))
    ax = Axis(fig[1, 1];
        title = "FIG. 02 — TELEMETRY SCATTER",
        xlabel = "x channel", ylabel = "y channel",
    )
    markers = (:circle, :rect, :utriangle)
    for g in 1:3
        idx = groups .== g
        scatter!(ax, x[idx], y[idx];
            color = CASSETTE_PALETTE[g], marker = markers[g],
            label = "module $g")
    end
    axislegend(ax, position = :lt)
    fig
end
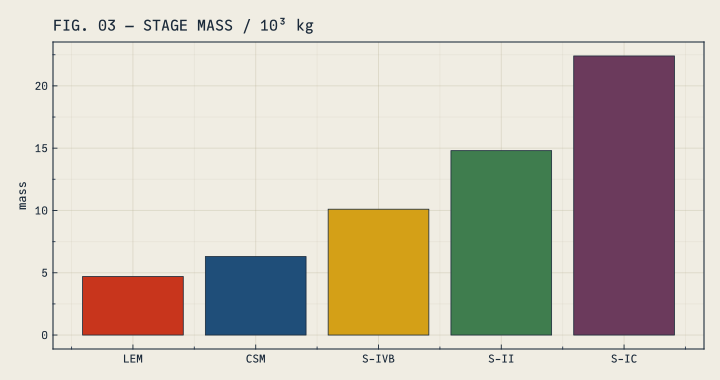
Bars: comparative readouts
let
    cats   = ["LEM", "CSM", "S-IVB", "S-II", "S-IC"]
    values = [4.7, 6.3, 10.1, 14.8, 22.4]
    fig = Figure(size = (720, 380))
    ax = Axis(fig[1, 1];
        title = "FIG. 03 — STAGE MASS / 10³ kg",
        xticks = (1:length(cats), cats),
        ylabel = "mass",
    )
    barplot!(ax, 1:length(cats), values;
        color = CASSETTE_PALETTE[1:length(cats)])
    fig
end
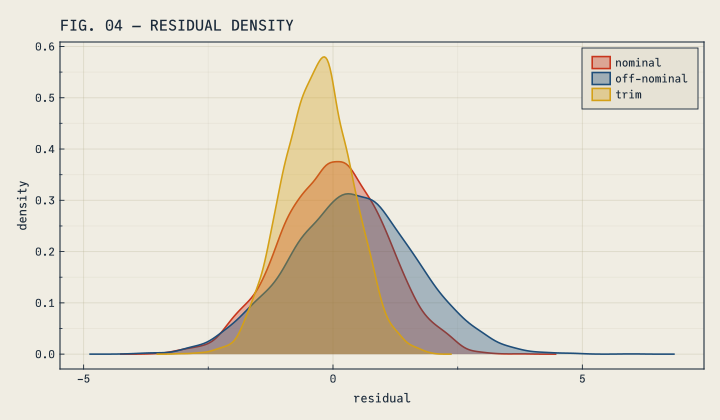
Density: distributions
let
    fig = Figure(size = (720, 420))
    ax = Axis(fig[1, 1];
        title = "FIG. 04 — RESIDUAL DENSITY",
        xlabel = "residual", ylabel = "density",
    )
    for (i, (μ, σ, name)) in enumerate(((0.0, 1.0, "nominal"),
                                        (0.4, 1.3, "off-nominal"),
                                        (-0.3, 0.7, "trim")))
        s = rand(Normal(μ, σ), 4_000)
        density!(ax, s; color = (CASSETTE_PALETTE[i], 0.35),
            strokecolor = CASSETTE_PALETTE[i], strokewidth = 1.6,
            label = name)
    end
    axislegend(ax, position = :rt)
    fig
end
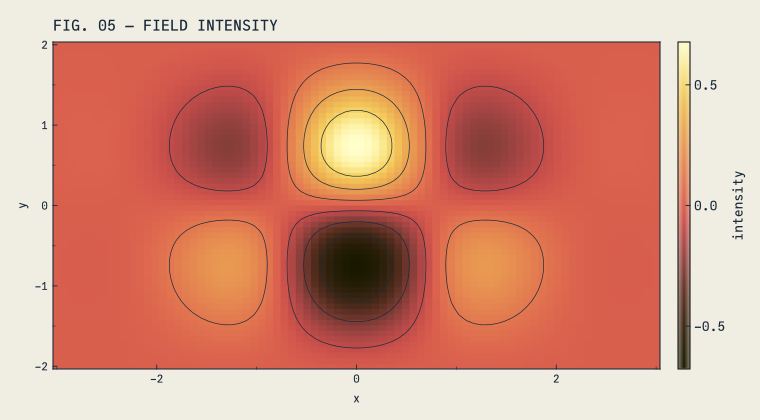
Heatmap: instrument grid
let
    xs = range(-3, 3; length = 80)
    ys = range(-2, 2; length = 60)
    z  = [exp(-(x^2 + y^2) / 2) * cos(2x) * sin(1.5y) for x in xs, y in ys]
    fig = Figure(size = (760, 420))
    ax = Axis(fig[1, 1];
        title = "FIG. 05 — FIELD INTENSITY",
        xlabel = "x", ylabel = "y",
    )
    hm = heatmap!(ax, xs, ys, z)
    contour!(ax, xs, ys, z; levels = 6, color = CF_INK, linewidth = 0.7)
    Colorbar(fig[1, 2], hm; label = "intensity")
    fig
end
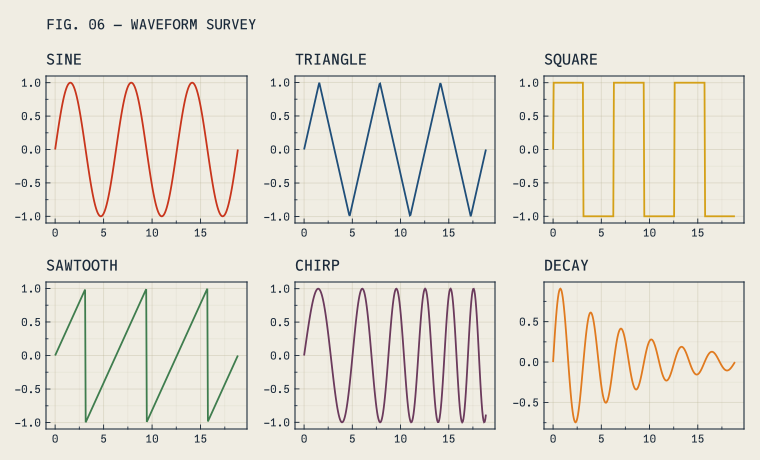
Small multiples
let
    t = range(0, 6π; length = 300)
    fig = Figure(size = (760, 460))
    Label(fig[0, 1:3], "FIG. 06 — WAVEFORM SURVEY";
        font = "JuliaMono", fontsize = 14, halign = :left, color = CF_INK)
    forms = (
        ("sine",       sin),
        ("triangle",   t -> (2 / π) * asin(sin(t))),
        ("square",     t -> sign(sin(t))),
        ("sawtooth",   t -> 2 * (t / (2π) - floor(0.5 + t / (2π)))),
        ("chirp",      t -> sin(t * (1 + t / 20))),
        ("decay",      t -> exp(-t / 8) * sin(2t)),
    )
    for (i, (name, f)) in enumerate(forms)
        row, col = fldmod1(i, 3)
        ax = Axis(fig[row, col]; title = uppercase(name))
        lines!(ax, t, f.(t); color = CASSETTE_PALETTE[i])
    end
    fig
end
Theme source: assets/themes/cassette_futurism.jl. JuliaMono is a placeholder — a more draftsman-style face is planned.